Dashboard preview for Aiven for Grafana®
Grafana's Dashboard Previews feature is a great way to get an overview of all your dashboards. Instead of a list view of all your dashboards, you can now see a graphical representation for each dashboard configured.
The dashboard previews feature is an opt-in beta feature available in Grafana 9.0+. This feature is disabled by default on the Aiven for Grafana® service.
Dashboard previews are not available for Hobbyist and Startup-1 plans.
Enable dashboard previews
Follow these steps to enable dashboard previews for your Aiven for Grafana service:
-
In the Aiven Console, select your project and then choose your Aiven for Grafana® service.
-
In the service page, select Service settings from the sidebar.
-
On the Service settings page, scroll down to the Advanced configuration section, and click Configure.
-
In the Advanced configuration dialog, click Add configuration option.
-
Find and set
dashboad_previews_enabledto Enabled position. -
Click the Save configuration. You will notice the status next to
dashboad_previews_enabledchange fromnot syncedtosynced. -
Using the Service URI, open the Grafana login page.
-
Enter the username and password, and click Log in.
-
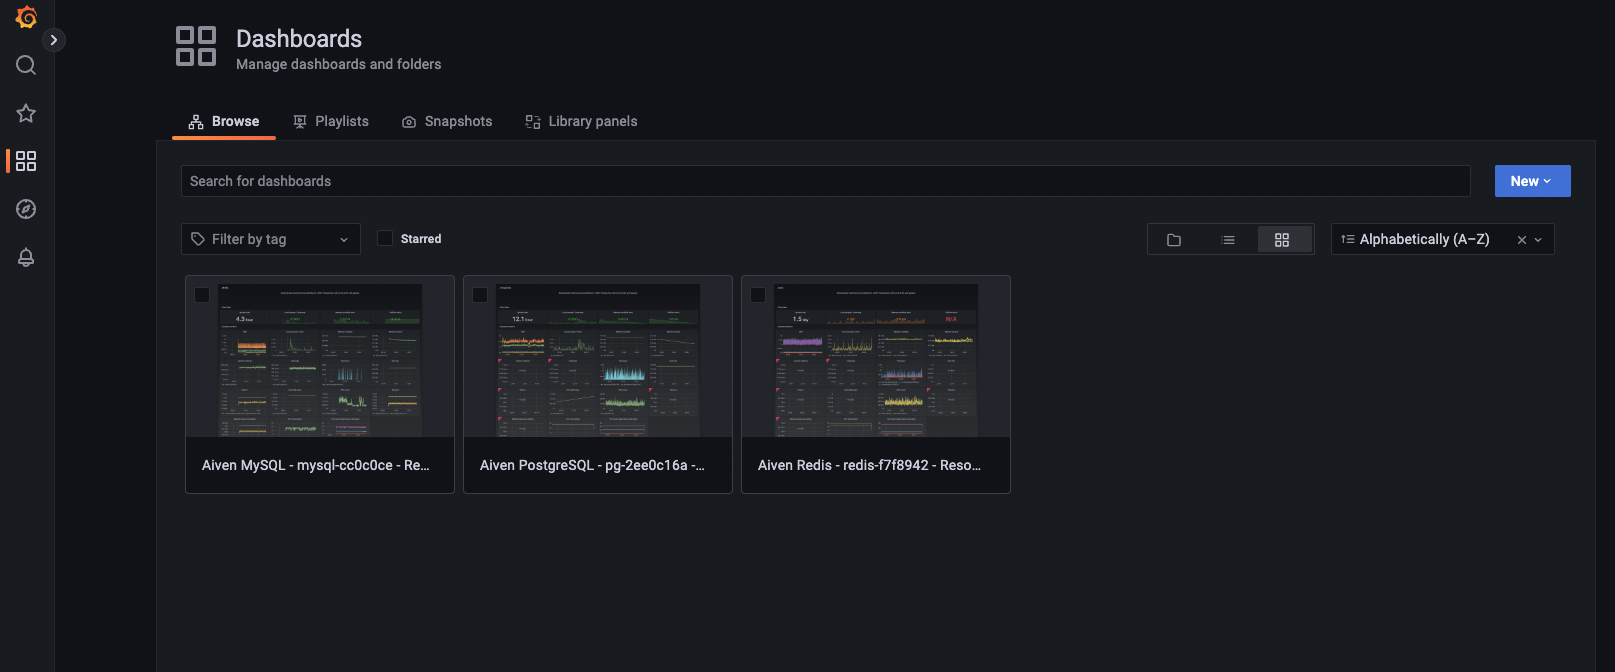
Click Dashboards on the left side menu, and select the grid layout to view dashboard previews of all the dashboards. Dashboard previews are rendered as thumbnails and can be sorted alphabetically.
Limitations
- Dashboard previews are not available for Hobbyist and Startup-1 plans.
- Before downgrading your service plan to Hobbyist or Startup-1, where dashboard previews are unavailable, you need first to disable it on the current service.
Related pages
For more information on Dashboard previews, see Grafana documentation.